fluxogram – Welcome to our online tool! Here are some of the features that make our tool exceptional and easy to use. Explore each feature to understand how it can benefit you.
Add and Link Cards

Start by adding a card for each process step in your business or organization. Link the cards to allow for downstream calculations. Heatmap colors will indicate the relative points of interest in the flow chart so you can discover areas to improve. Apply your own methods to reduce waste time and cost. Gather tribal knowledge from teams to expose a 360 view of your organisation.
- Add cards and data for each
- link cards in downstream flow charts
- discover your current flow
a Flowchart of Linked Stat Cards

At the core of the fluxogram tool is a user friendly canvas board on which you can place cards, add stats, text and data to each card, and link them in a process map that can be used for value stream mapping, process optimization, defining SLA-SLO-SLI, reduce waste in time and resources, optimize profit margins.
- Add cards and data for each
- link cards in downstream flow charts
- choose how many data fields to add to each card
Selection, Drag and Drop
Cards can be selected, dragged and dropped elsewhere on the canvas. Cards can be selected one by one, or by dragging a selection rectangle around the cards. All selected cards will be moved simultenously. Any cards that are selected can also be grouped or deleted.
- Select one or multiple cards
- Drag and drop all selected cards
- Dropping a card in a group will add that card to the group
- Selected cards can be grouped or deleted
Snap to Grid, Show/Hide Grid
All cards can be placed freely on the flow chart board, but if you wish you can enable snap to grid to easily align all cards. The grid can be shown or hidden independently while still allowing for cards to snap to grid.
- option to snap to grid
- option to show or hide the grid
- easily align cards based on a grid
Context Menu
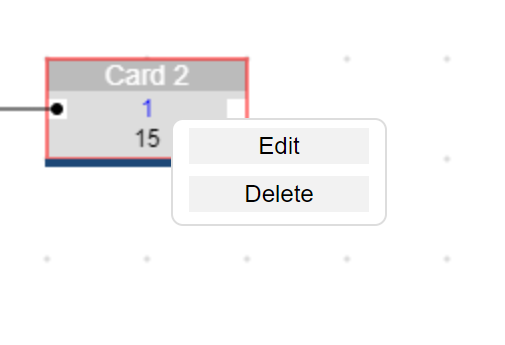
Context Menu for cards. Mouse right click on card to show card options such as edit and delete.
- mouse right click on card
- choose action
- click outside of context menu to close
Modal Edit

Modal edit allows for card editing while in flowchart mode. Cards can also be edited by changing the values in the table view.
- Edit your card attributes
- Click submit button to save changes
- Click close icon to cancel editing
- If you want to add more attribute fields do so in the fields table view tab
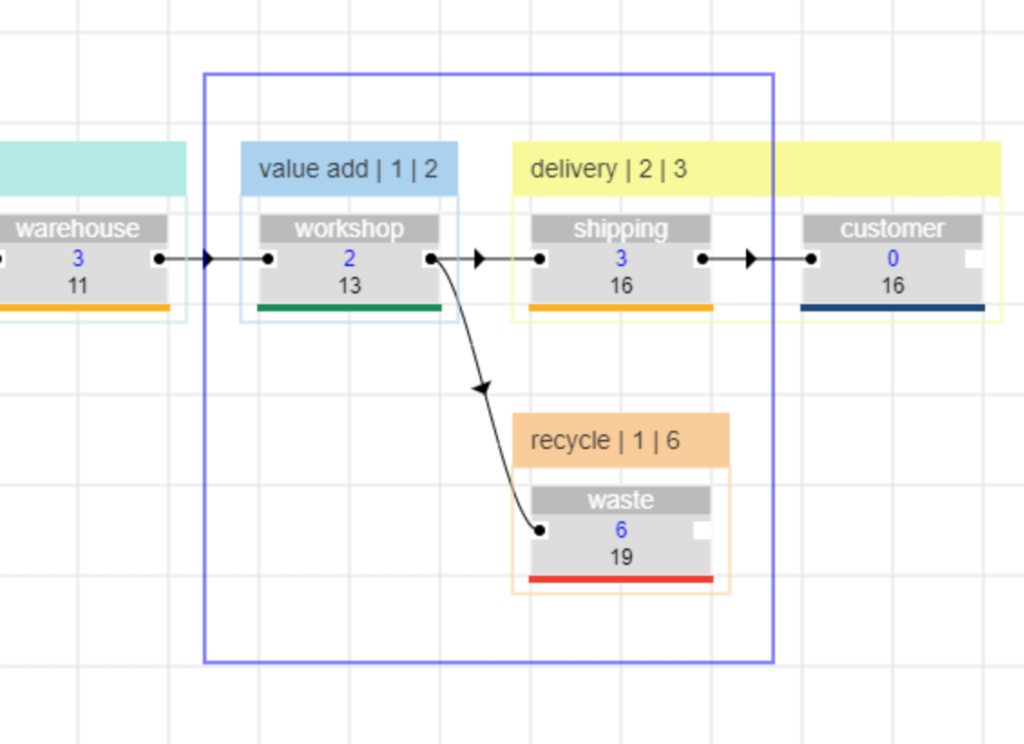
Downstream Calculated Rollup
Each card can hold data for several data fields. Any numeric field will be calculated downstream and a subtotal will be shown on each card based on its own value and all all values upstream. The calculation will distinguish between parallel tasks and accumulative data. If 2 parallel tasks have a lead time of 2 weeks and 1 week each, then the total lead time upstream for that phase will be 2 weeks maximum, whereas the cost will be the combined cost for both those parallel streams.
- Add numeric data fields to your cards
- Downstream subtotals based on upstream values
- Distinguish between sum and max of values
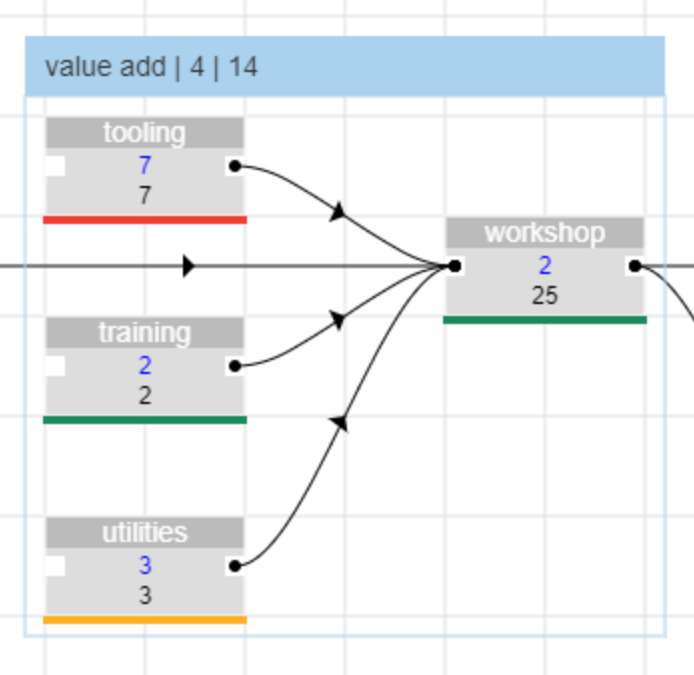
Weighted Link Calculation
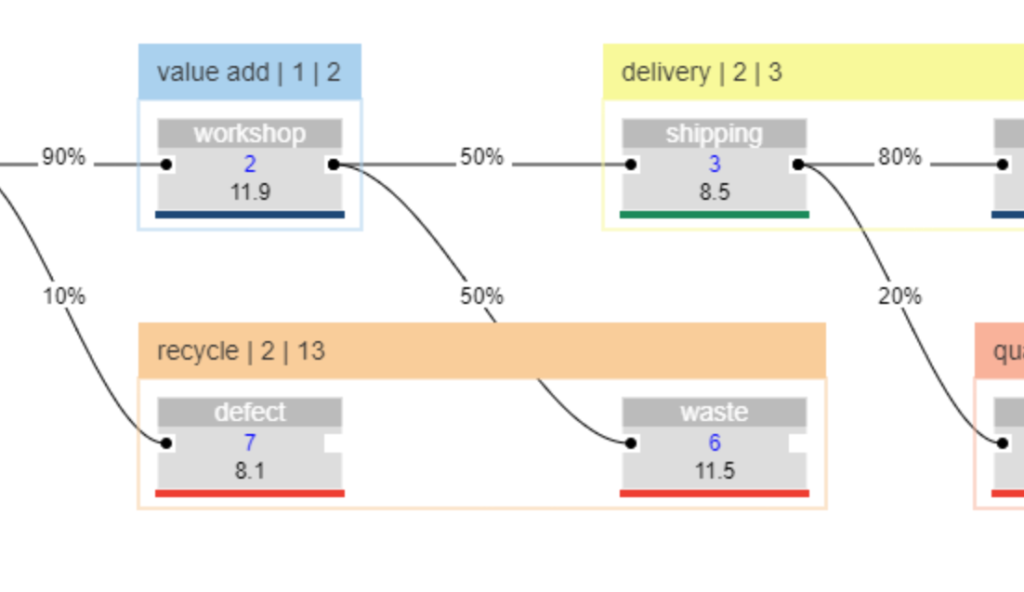
Card values have their downstream subtotals calculated based on upstream linked cards. Each of these links can have relative or absolute weights. You can separate streams and establish funnels from source to destination. You can apply your own logic in percentage or absolute count terms.
- Set relative percentages for each link
- Set absolute item count for each link
- Separate your streams and funnel your data
Custom Formula Calculated Card Values
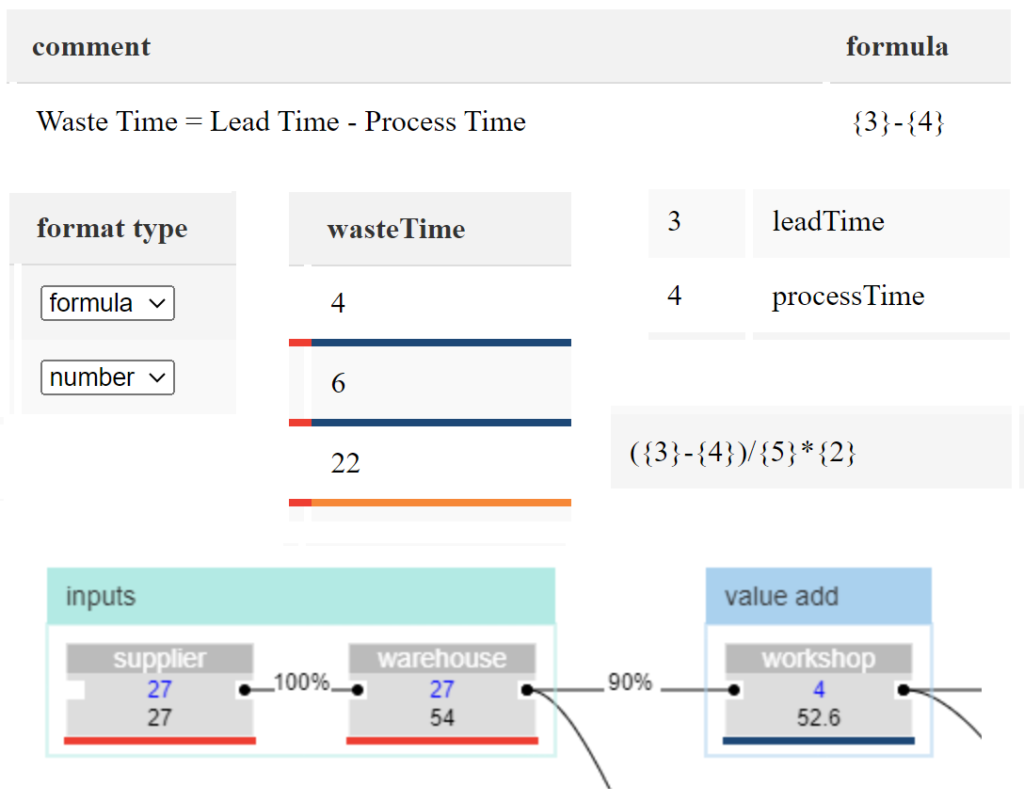
In addition to adding data to a card manually you can create formula fields which will take the other values of the same card and calculate a new value based on the formula you have provided. One example is that you might want to calculate wasteTime as the difference between total leadTime and value add processTime (wasteTime = leadTime – processTime). You can dig deeper and set this value relative to the Cost and Value it represents if you have those values stored in your other card fields. You can customize your fields and formulas to satisfy your use case. You have the option to customize to your own process mapping method.
- create a custom formula field
- use the values of existing fields
- satisfy your use case requirements
Sankey Diagram
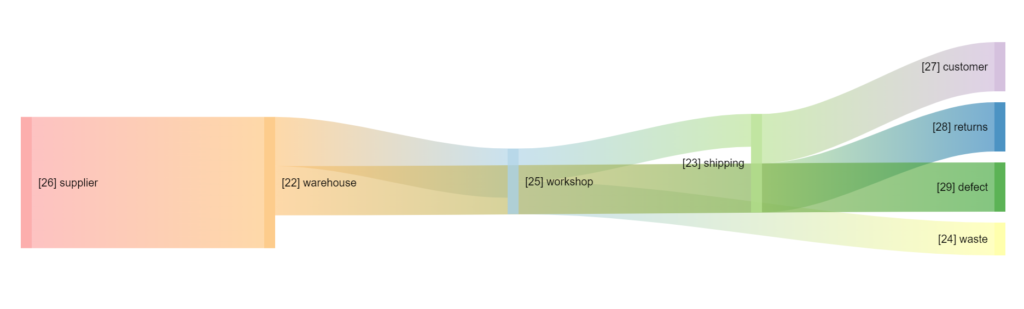
Sankey diagrams are a data visualisation technique or flow diagram that emphasizes flow/movement/change from one state to another or one time to another, in which the width of the arrows is proportional to the flow rate of the depicted extensive property. Sankey diagrams can also visualize the energy accounts, material flow accounts on a regional or national level, and cost breakdowns. The diagrams are often used in the visualization of material flow analysis. Sankey diagrams emphasize the major transfers or flows within a system. They help locate the most important contributions to a flow. They often show conserved quantities within defined system boundaries.
- Visualize your cost and value streams
- Proportional stream width
- Effective colorization
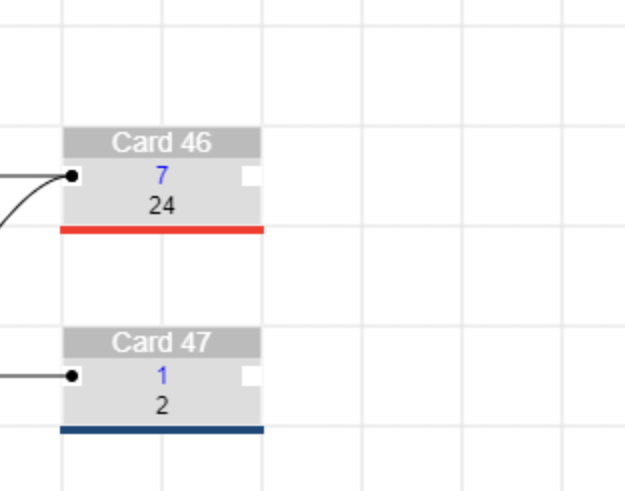
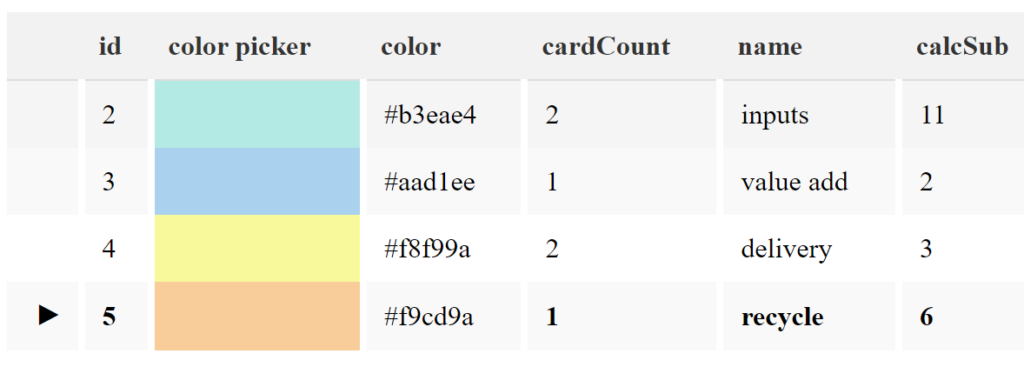
All Cards in a Table View

Get an overview of all cards in a handy table view. Sort and filter based on a text query. Change the title text, cost numbers, or any other number, text or boolean field you have defined in the fields table. Each numeric field also will get a heatmap defined color to easily find cards to focus on in terms of cost, time and other resources.
- table view with user defined fields
- sorting and text filtering
- the current card is highlighted for easy reference
- edit any card data right in each table cell
Grouping of Cards in the Flowchart

One or multiple cards can be added to a group. Each group will be visually represented by a rectangle around the cards on the flow chart board. Each group can be given a name and a color to easily distuingish the groups from each other. There are also other ways of semantically grouping cards by creating common fields such as ‘team’ or ‘tool’ and then add the same team or tool to several cards.
- Groups will visually connect cards with a bounding rectangle
- Moving the group will move all cards in the group
- Moving a card inside a group rectangle will add the card to that group
- First select cards and then either press the Keyboard G button or click the menu group butten
- cards can be ungrouped by selecting them and pressing the menu ungroup button
- cards can be assigned to a new group
- groups without any cards will be discarded
All Groups in a Table View
All groups are listed in a handy table view where both the title and the color can be changed inside the table cell.
- Edit the group name in the group’s cell
- Change the group color with a color picker or by changing the color hex code
- the current group will be hightlighted
All Links in a Table View

All the cards on the flow chart board can be linked in a downstream process map. All these links can easily be referenced in the links table view. The currently selected link is highlighed. All links can be given a method and a value. The method is either relative percentage or absolute count. The value will then be applied to the method. If a card has multiple links out downstream then each link can get a percentage of the output of that card, 50% – 25% – 25% for example for 3 links out.
- Links are connecting cards downstream
- Links cannot be added to their own upstream source to avoid infinite loop cycles
- Links have a method (%,#) and a value (n)
a List of Saved Boards
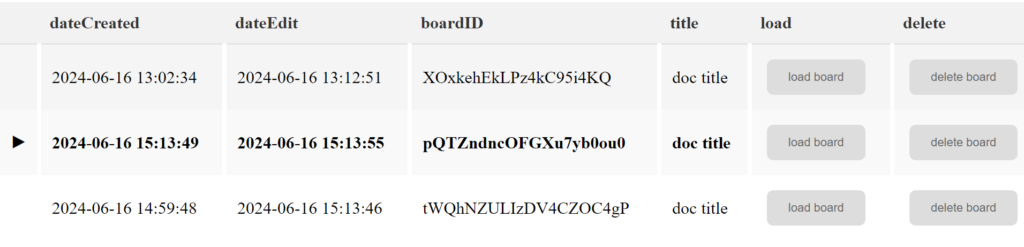
If your plan allows for multiple boards you will see them in the boards table. You can load a saved board or delete an existing board. You can also export the board as a json file to later upload again.
- Create multiple boards
- Load a board from the Cloud Database
- Save a board to the Cloud Database
- Import a board (json) from your local computer
- Export a board (json) to your local computer
Current Board Meta Info
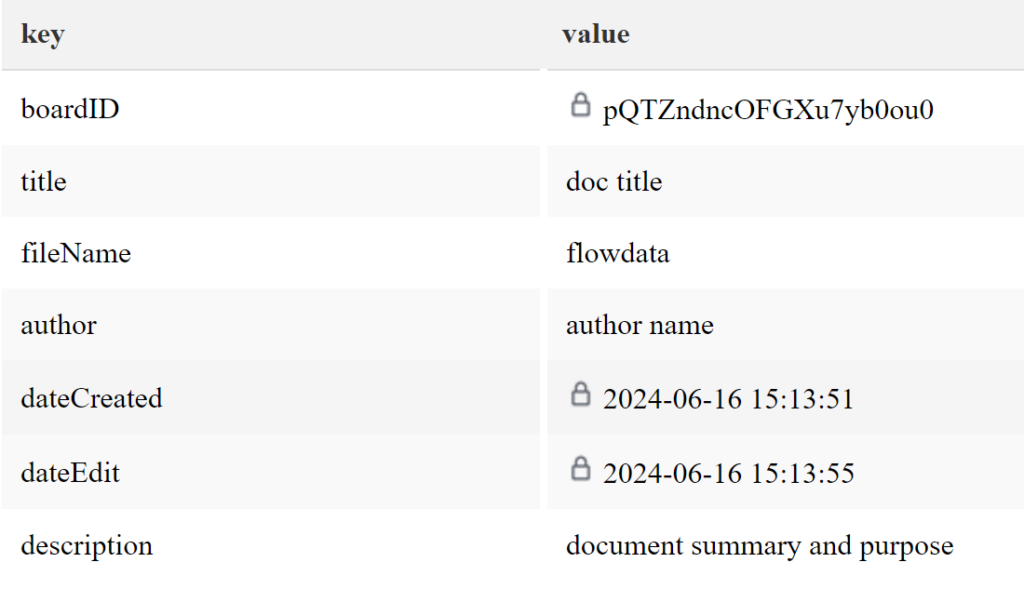
Each board can be given a title, an author, a description or summary and so on. This can be used for your own reference, to inform your team members or to help generate reports.
- Board title
- Board author
- Board summary
Duplicate Board
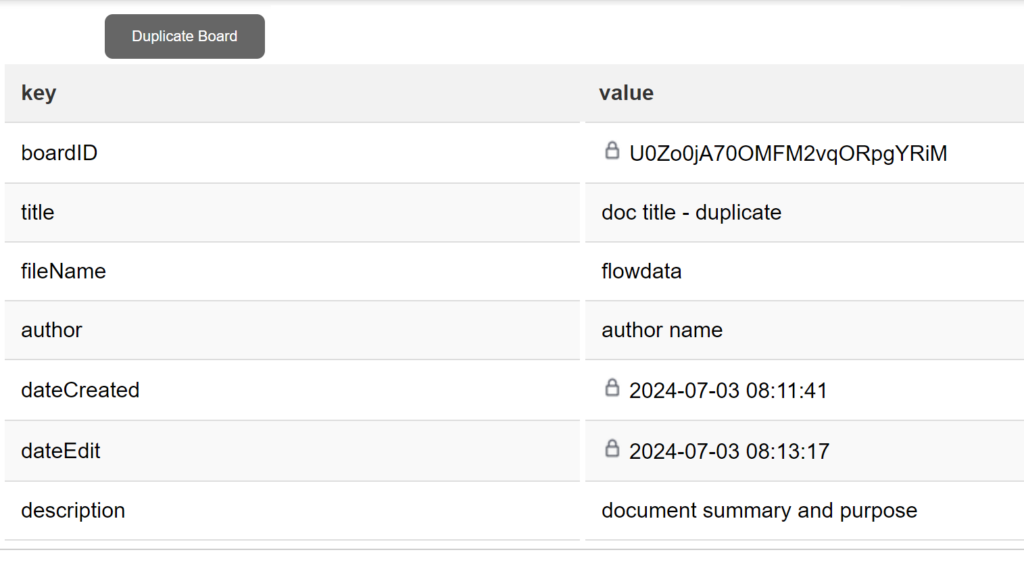
You can duplicate the current board, keeping all the cards, links, groups, fields and data. This acts like a ‘save as’ function and will automatically assign a new boardID, new dates and add the ‘ – duplicate’ postfix to the board title. You can then continue editing this board and choose to save it to the cloud or to export as a JSON file to your local computer.
- duplicate current board and data
- get a new boardID and board title
- continue editing without destroying the original board
Online Offline
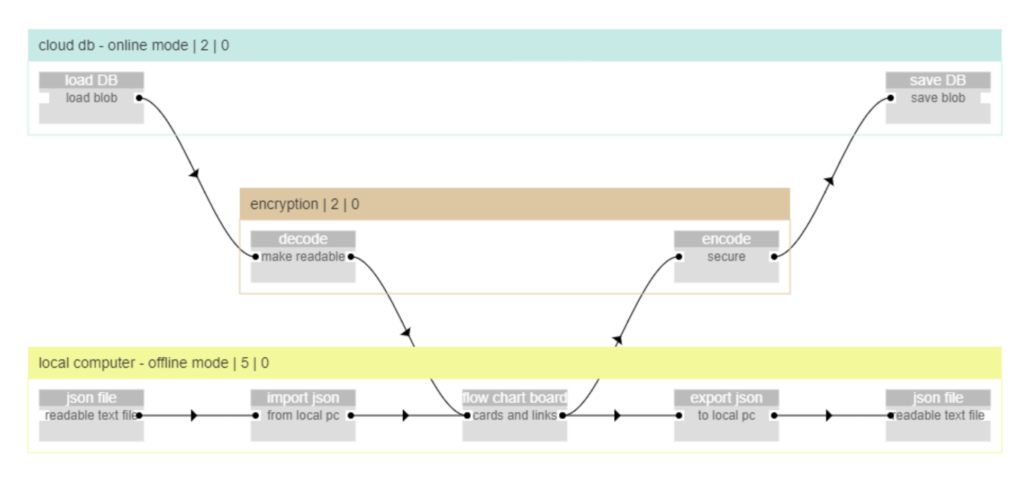
No data is being aggregated on the cloud side. The fluxogram flowchart board is being handled client side on the local computer. A local json file can be imported, the flow chart can be edited, a new flow chart can be created, and finally it is possible to export the flow chart as a json file on the local computer again. This can happen in offline mode after a login has been established. If you also want to store a copy in the cloud database you need to click the Save DB button after which your board will be saved as one blob. You can load any of your saved boards from the cloud database later.
- Export and Import JSON from your local computer
- Save and Load your JSON from the cloud database
- the flow chart is being handled client side on the local computer